The
-thorpes
-marginal
outlying farms or favoured agricultural settlements?
by
Laura Hedemand, Peder Dam & Johnny Grandjean Gøgsig Jakobsen
This article has been generated by a settlement-historical analysis
performed by three students of the University of Roskilde. The authors have
examined the geographical allocation of various Danish settlement types compared
to the type of soil of their immediate neighbourhood. Based on the place-name
theory, the article focuses on two groups of villages, namely a group consisting
of place-name types from the Iron Age (-inge, -lev, -løse,
-um (-hem) and -sted) and the thorpes (-rup, -strup
and -drup). The investigation was based on a digitalisation of the
accurate position of all Danish villages (in 1682) on a computerised map of
Denmark, which afterwards was compared to a digital soil map. By using the
GIS-programme ArcView, the soil type distribution in different distances from
the village centre was calculated, in order to identify any soil variations in
the potential infield area of the two village groups. The purpose of the entire
analysis was to test the various theories about the foundation of the thorpes in
late Viking Age and the beginning of the High Middle Ages.
The “classical” theory has been that the thorpes were built on
marginal lands in accordance with a major increase of the population. Because of
this marginal allocation and a general fall in population during the 14.th
century, many thorpes were abandoned and dismantled during the so-called “Late
Medieval Crisis”. This theory was first challenged by Viggo Hansen, who found
basis for a close relation between the foundation of the thorpes and an
increasing importance of distance as a cost parameter in a period, where Danish
agriculture is supposed to have changed from being based on cattle to be based
on grain. Especially transportation of manure and ploughing would make it worth
while considering to raise a farmstead or even a hamlet on land more than 1 km
away from the old village. Erland Porsmose too, in his many studies of the
settlement patterns of Funen, was able to reject the idea of thorpes as
marginalized hamlets on unfertile wasteland. On the contrary, Porsmose found
signs of the exact opposite situation, as the thorpes of Funen seemed to be
equal or even better off than the old villages (’adelbyerne’) in matters
such as fertility of the soil and distribution of meadows.
The present GIS-based analysis for the whole of Denmark did not support the findings from Funen. The study showed, that the old villages (with Iron Age place-name types) had a significant larger amount of loamy soil types in their surrounding area than did the thorpes. The same result occurred with different strength on national and regional level; only in Funen and Northern Jutland the differences were not statistical significant. Due to general studies of the fertility of the different soil types, this result could support the first mentioned theory of marginalisation. Against this interpretation, it could be argued, that the high water content of loam could be anticipated to perform a problem (due to poor drainage) for the medieval farmer, just as the introduction of new crops such as rye and oats would make sandy soil less secondary to loam, but this does not explain, that even in areas with only sand and loamy sand (such as most of Jutland), the thorpes still were situated on more sandy soil than the old villages. The analysis was concluded by a study of three districts (’herreder’) in North-West Zealand with different soil types and place-name distributions. Here, both the village types and the soil types were held up against the land taxation of 1688. In all three districts, there was a distinct tendency towards higher taxation of the soil types, where the old villages were dominating.
|
Soil code |
Soil
type
|
Relative
textural distribution of soil types |
|||||
|
|
|
Clay <2mm |
Silt 2-20mm |
Fine sand
20-200mm |
Sand in
total 20-2000mm |
Humus |
CaCO3 |
|
FK1 |
Coarse sand |
0-5 |
0-20 |
0-50 |
75-100 |
£10 |
£10 |
|
FK2 |
Fine sand |
|
|
50-100 |
|
|
|
|
FK3 |
Loamy sand |
5-10 |
0-25 |
0-95 |
65-95 |
|
|
|
FK4 |
Sandy loam |
10-15 |
0-30 |
0-90 |
55-90 |
|
|
|
FK5 |
Loam |
15-25 |
0-35 |
|
40-85 |
|
|
|
FK6 |
Clay Silt |
25-100 0-50 |
0-50 20-100 |
|
0-75 0-80 |
|
|
|
FK7 |
Humus soil |
|
>10 |
10-90 |
|||
|
FK8 |
Special soil types |
|
£10 |
>10 |
|||
Table 1. The
Danish soil classification. (All numbers in %)
|
Soil code |
Area
in km2 |
%
of the total area |
|
FK1 |
10.548 |
24.5 |
|
FK2 |
4.233 |
9.8 |
|
FK3 |
11.522 |
26.8 |
|
FK4 |
9.838 |
22.9 |
|
FK5 |
2.389 |
5.6 |
|
FK6 |
303 |
0.7 |
|
FK7 |
2.091 |
4.9 |
|
FK8 |
86 |
0.2 |
|
Cities |
1.703 |
4.0 |
|
Lakes |
291 |
0.7 |
Table 2. The total distribution of soil types in Denmark and the Danish soil map.
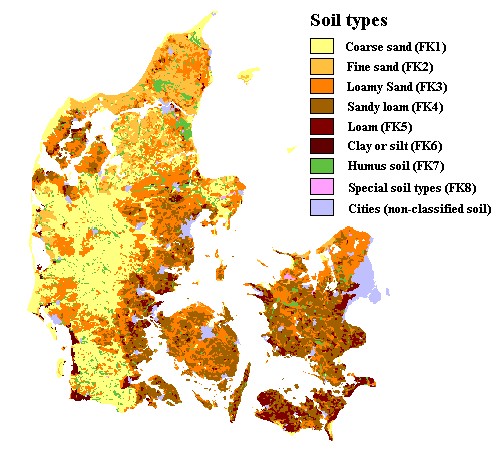
Fig.
1. Distribution of soil types of the two village groups in all of Denmark.
Fig. 2. The regions of the regional analysis.
|
Soil
types (soil codes) |
|||||||
|
Regions |
FK1 |
FK2 |
FK3 |
FK4 |
FK5 |
FK6 |
FK7 |
|
North
East Zealand |
1.08 |
5.54 |
54.91 |
14.45 |
4.31 |
0.13 |
3.01 |
|
(The
rest of) Zealand |
1.12 |
1.87 |
21.55 |
57.28 |
10.48 |
0.12 |
3.45 |
|
Lolland,
Falster & Møn |
2.39 |
2.14 |
9.46 |
41.72 |
39.44 |
1.14 |
1.37 |
|
Funen
& Samsø |
1.74 |
1.76 |
36.43 |
51.09 |
2.61 |
0.44 |
1.33 |
|
Western
Jutland |
61.04 |
5.68 |
21.55 |
3.13 |
0.61 |
1.06 |
5.11 |
|
Eastern
Jutland |
24.42 |
2.23 |
36.32 |
23.46 |
4.24 |
0.32 |
4.15 |
|
Viborg
County |
30.34 |
12.54 |
35.36 |
12.93 |
2.17 |
0.30 |
4.69 |
|
Northern
Jutland |
15.30 |
45.94 |
24.33 |
2.05 |
0.88 |
0.07 |
9.12 |
Table 3. The distribution of soil types in the regions. (All numbers in %)
Fig. 3. Zealand (without North-East Zealand)
Fig. 4. Eastern Jutland
Fig. 5. Western Jutland
Regions that did not show statistiscal significant differences
between the village groups or did not follow the main trend:
Fig. 6. Funen & Samsø
Fig. 7. Northern Jutland
Fig.
8. Lolland, Falster & Møn.
An
example of the soil type distribution on villages in a local district of
North-West Zealand:
Fig. 9. Merløse Herred.
This district only includes -løse villages of the Iron Age place name group. As it is also one of the districts in Denmark with most thorpes, it becomes quite interesting for this analysis, since all the thorpes can be expected to have been separated from original -løse land. In total, the district includes 14 -løse villages and 51 -thorpes.
Fig. 10. The soil type distribution of three different Iron Age village types in North-West Zealand (Holbæk County).
Here we find, that the differences between thorpes and Iron Age villages are smaller than in the 500 m zone, but still statistical significant. The analysis also showed a significant difference in the areas of the size of the “ejerlav” between the two village groups; while the average -thorpe had an area of 3.2 km2, the average Iron Age village had an “ejerlav” of 5.7 km2.
|
|
|
|
|
|
|
|
|
|
Return to CV for JGGJ (in English) |
|